 Samco Dynamic Asset Allocation Fund - Direct IDCW

 Fund Overview
The investment objective of the Scheme is to generate income/long-term capital appreciation by investing in equity, equity derivatives, fixed income instruments and foreign securities. The allocation between equity instruments and fixed income will be managed dynamically so as to provide investors with long term capital appreciation while managing downside risk.
However, there can be no assurance or guarantee that the investment objective of the scheme would be achieved
| Key Highlights |
|---|
| Momentum Trend following system - Only stay in the equities when the markets are trending upside |
| Drawdown Protection - Aim to limit drawdown during bear markets. |
| Dynamic in nature - A hybrid fund that can transform in to 100% Net Equity & 0% Debt or 100% Debt & 0% Net Equity. The fund doesn’t follow a static asset allocation. |
| Real time allocation model - Allows quick re-allocation to Debt from Equity Model and doesn’t wait for rebalancing cycles at monthly / quarterly frequencies. |
| Stop loss model - Quickly cuts equity exposure, risks and protects downside in tough times |
|
Type of scheme
|
An open ended dynamic asset allocation fund
|
|
Plans
|
|
|
Options
|
Growth option & Income Distribution cum Capital Withdrawal (IDCW) Option - IDCW - Reinvestment, IDCW – Payout, IDCW - Transfer
|
|
Benchmark Index
|
NIFTY 50 Hybrid Composite Debt 50:50 Index
|
|
STP Frequency
|
|
|
Minimum Application Amount of scheme
|
₹ 5000 and in multiples of ₹ 1/- thereafter
|
|
Minimum Additional Application Amount
|
₹ 500 and in multiples of ₹ 1/- thereafter
|
|
Minimum SIP Amount
|
₹ 250 and in multiples of ₹ 1/- thereafter
|
|
Entry Load
|
Not applicable
|
|
Exit Load
|
|
Fund Manager
|

Mr. Umeshkumar MehtaDirector, CIO & Fund Manager 
Mrs. Nirali BhansaliFund Manager 
Mr. Dhawal DhananiFund Manager 
Mr. Vishal ShindeFund Manager |
 Portfolio
| Issuers | Industry | % Of Net Assets | % to Derivatives |
|---|---|---|---|
| Indian Equity and Equity Related Total | 67.51 | -7.96 | |
| Religare Enterprises Limited | Finance | 8.67 | |
| Laurus Labs Limited | Pharmaceuticals & Biotechnology | 1.20 | 1.04 |
| Apar Industries Limited | Electrical Equipment | 1.56 | |
| HFCL Limited | Telecom - Services | 1.46 | |
| Welspun Corp Limited | Industrial Products | 1.39 | |
| Bharat Forge Limited | Auto Components | 0.87 | 0.49 |
| The Federal Bank Limited | Banks | 0.77 | 0.57 |
| Ather Energy Limited | Automobiles | 1.31 | |
| FSN E-Commerce Ventures Limited | Retailing | 1.04 | 0.19 |
| Hitachi Energy India Limited | Electrical Equipment | 1.12 | 0.10 |
| Adani Energy Solutions Limited | Power | 1.58 | -0.47 |
| Samvardhana Motherson International Limited | Auto Components | 1.53 | -0.43 |
| Multi Commodity Exchange of India Limited | Capital Markets | 0.71 | 0.36 |
| Marico Limited | Agricultural Food & other Products | 0.35 | 0.66 |
| Titan Company Limited | Consumer Durables | 1.37 | -0.38 |
| Torrent Pharmaceuticals Limited | Pharmaceuticals & Biotechnology | 2.43 | -1.47 |
| Adani Power Limited | Power | 2.07 | -1.12 |
| Bank of Maharashtra | Banks | 0.90 | |
| Anand Rathi Wealth Limited | Capital Markets | 0.89 | |
| GE Vernova T&D India Limited | Electrical Equipment | 0.89 | |
| Aditya Birla Capital Limited | Finance | 0.88 | |
| Kirloskar Oil Engines Limited | Industrial Products | 0.85 | |
| Shriram Finance Limited | Finance | 1.31 | -0.48 |
| Acutaas Chemicals Limited | Pharmaceuticals & Biotechnology | 0.81 | |
| L&T Finance Limited | Finance | 0.69 | 0.12 |
| National Aluminium Company Limited | Non - Ferrous Metals | 0.60 | 0.21 |
| Syrma SGS Technology Limited | Industrial Manufacturing | 0.79 | |
| AU Small Finance Bank Limited | Banks | 0.60 | 0.19 |
| Apollo Hospitals Enterprise Limited | Healthcare Services | 1.19 | -0.40 |
| Vedanta Limited | Diversified Metals | 1.40 | -0.61 |
| CG Power and Industrial Solutions Limited | Electrical Equipment | 1.27 | -0.50 |
| Granules India Limited | Pharmaceuticals & Biotechnology | 0.75 | |
| Hindalco Industries Limited | Non - Ferrous Metals | 1.48 | -0.73 |
| BSE Limited | Capital Markets | 0.62 | 0.08 |
| Adani Green Energy Limited | Power | 0.91 | -0.22 |
| JSW Steel Limited | Ferrous Metals | 0.77 | -0.11 |
| Cummins India Limited | Industrial Products | 1.71 | -1.05 |
| Adani Ports and Special Economic Zone Limited | Transport Infrastructure | 0.87 | -0.23 |
| Eicher Motors Limited | Automobiles | 1.02 | -0.38 |
| NMDC Limited | Minerals & Mining | 0.57 | 0.07 |
| Lupin Limited | Pharmaceuticals & Biotechnology | 0.50 | 0.11 |
| Hero MotoCorp Limited | Automobiles | 0.40 | 0.20 |
| Chennai Petroleum Corporation Limited | Petroleum Products | 0.60 | |
| Indian Bank | Banks | 0.58 | |
| Union Bank of India | Banks | 1.05 | -0.49 |
| Schneider Electric Infrastructure Limited | Electrical Equipment | 0.53 | |
| Alkem Laboratories Limited | Pharmaceuticals & Biotechnology | 0.40 | 0.12 |
| The Jammu & Kashmir Bank Limited | Banks | 0.51 | |
| APL Apollo Tubes Limited | Industrial Products | 0.22 | 0.28 |
| Ashok Leyland Limited | Agricultural, Commercial & Construction Vehicles | 0.43 | 0.05 |
| Axis Bank Limited | Banks | 0.86 | -0.38 |
| State Bank of India | Banks | 1.08 | -0.61 |
| Karur Vysya Bank Limited | Banks | 0.45 | |
| Bank of India | Banks | 0.39 | 0.04 |
| Coal India Limited | Consumable Fuels | 0.91 | -0.51 |
| Life Insurance Corporation Of India | Insurance | 0.40 | |
| LIC Housing Finance Limited | Finance | 0.36 | 0.03 |
| Tata Steel Limited | Ferrous Metals | 0.99 | -0.60 |
| Shipping Corporation Of India Limited | Transport Services | 0.39 | |
| Max Financial Services Limited | Insurance | 0.33 | 0.04 |
| Canara Bank | Banks | 0.67 | -0.31 |
| MRF Limited | Auto Components | 0.36 | |
| Indus Towers Limited | Telecom - Services | 0.27 | 0.08 |
| General Insurance Corporation of India | Insurance | 0.35 | |
| Hindustan Petroleum Corporation Limited | Petroleum Products | 0.33 | |
| Bank of Baroda | Banks | 0.56 | -0.25 |
| The Great Eastern Shipping Company Limited | Transport Services | 0.30 | |
| NTPC Limited | Power | 0.76 | -0.47 |
| Tata Motors Passenger Vehicles Limited | Automobiles | 0.60 | -0.33 |
| Power Finance Corporation Limited | Finance | 0.73 | -0.46 |
| Debt Instruments | 15.06 | ||
| 7.38% GOI (MD 20/06/2027) | Sovereign | 15.06 | |
| TREPS, Cash, Cash Equivalents and Net Current Asset | Cash & Cash Equivalents | 25.39 | |
| Grand Total | 100 |
 Fund Performance (as on 2026-08-31)
| Period | Fund Returns (%) | Benchmark Returns (%) | Additional Benchmark Returns (%) | Value of Investment of 10,000 | ||
|---|---|---|---|---|---|---|
| Fund (₹) | Benchmark (₹) | Additional Benchmark (₹) | ||||
| Regular Plan - Growth Option | ||||||
| Last 1 year | -0.49% | 1.38% | -0.35% | 9,951 | 10,138 | 9,965 |
| Since Inception | 0.89% | 5.70% | 5.12% | 10,240 | 11,599 | 11,430 |
| Direct Plan - Growth Option | ||||||
| Last 1 year | 1.04% | 1.38% | -0.35% | 10,104 | 10,138 | 9,965 |
| Since Inception | 2.52% | 5.70% | 5.12% | 10,690 | 11,599 | 11,430 |
Benchmark: Nifty 50 Hybrid Composite Debt 50:50 Index Additional Benchmark: Nifty 50 TRI Inception/Allotment date: 28-Dec-23
Past performance may or may not be sustained in the future and is not a gurantee of any future returns. Returns computed on compounded annualised basis based on the NAV. Different Plans i.e. Regular Plan and Direct Plan under the scheme has different expense structure. The “since inception” returns of the scheme are calculated on Rs. 10/- invested at inception. The Fund is co-managed by Mr. Umeshkumar Mehta (since inception), Mrs. Nirali Bhansali (since February 19, 2025), Mr. Dhawal Ghanshyam Dhanani (since inception), Mr. Vishal Shinde (since July 01, 2026) . In case, the start / end date of the concerned period is a non-business date (NBD), the NAV of the previous date is considered for computation of returns.
| Period | Amount invested (Rs) | Fund Value (Rs) | Fund Returns (%) | Benchmark value (Rs) | Benchmark Returns (%) | Additional Benchmark Value (Rs) | Additional Benchmark Returns (%) |
|---|---|---|---|---|---|---|---|
| Direct Plan - Growth Option | |||||||
| Last 1 year | 120,000 | 120,959.15 | 1.49% | 119,881 | -0.18% | 118,045 | -3.01% |
| Since Inception | 320,000 | 321,036.84 | 0.24% | 333,538 | 3.05% | 326,649 | 1.51% |
| Regular Plan - Growth Option | |||||||
| Last 1 year | 120,000 | 119,991.91 | -0.01% | 119,881 | -0.18% | 118,045 | -3.01% |
| Since Inception | 320,000 | 314,299.84 | -1.31% | 333,538 | 3.05% | 326,649 | 1.51% |
Benchmark: Nifty 50 Hybrid Composite Debt 50:50 Index Additional Benchmark: Nifty 50 TRI Inception/Allotment date: 28-Dec-23
Past performance may or may not be sustained in the future and is not a gurantee of any future returns. For SIP returns, monthly investment of Rs.10,000 invested on the 1st business day of every month has been considered. CAGR Returns (%) are computed after accounting for the cash flow by using the XIRR method (investment internal rate of return). The Fund is co-managed by Mr. Umeshkumar Mehta (since inception), Mrs. Nirali Bhansali (since February 19, 2025), Mr. Dhawal Ghanshyam Dhanani (since inception), Mr. Vishal Shinde (since July 01, 2026). In case, the start / end date of the concerned period is a non-business date (NBD), the NAV of the subsequent date is considered for computation of returns.
 Frequently asked questions
The investment objective of the Scheme is to generate income/long-term capital appreciation by investing in equity, equity derivatives, fixed income instruments and foreign securities. The allocation between equity instruments and fixed income will be managed dynamically so as to provide investors with long term capital appreciation while managing downside risk.
The scheme follows a dynamic asset allocation strategy, with net equity exposure ranging from 0% to 100% based on SAMCO's proprietary TRANSFORMER model. While gross equity exposure is generally maintained between 65% and 100%, derivative strategies may be used to reduce net equity exposure during adverse market conditions. The model allocates more towards equities during strong market trends and shifts towards debt when market momentum weakens or volatility rises. It also incorporates trailing stop-loss mechanisms and mean-reversion signals to manage downside risk. Portfolio rebalancing is undertaken on a real-time basis, enabling the scheme to respond promptly to changing market conditions.
Click here to learn about the Fund's investmstment strategy.
The scheme's proprietary TRANSFORMER follows a rules-based dynamic asset allocation framework that combines trend-following and mean-reversion signals to determine equity and debt exposure. It evaluates a broad range of market and macroeconomic indicators, including equity market trends, moving averages, market breadth, 52-week highs and lows, trading volumes, India VIX, credit spreads, interest rates and yield curves, relative strength across asset classes and sectors, valuation metrics such as market capitalisation-to-GDP and earnings yields, as well as rolling returns and retail participation. Based on these indicators, the model increases equity allocation during favourable market trends and gradually reduces exposure during periods of weakening momentum, elevated volatility, or adverse market conditions. It also incorporates trailing stop-loss mechanisms and extreme valuation signals to limit downside risk and identify potential market reversals. Portfolio rebalancing is undertaken on a real-time basis, enabling the scheme to dynamically respond to changing market conditions while seeking to optimise risk-adjusted returns.
An illustration of how the TRANSFORMER model will move from Equity to Debt & Arbitrage Strategies:
Click here to view the TRANSFORMER Model illustration.
The benchmark of the scheme is NIFTY50 Hybrid Composite Debt 50: 50 Index.
Entry Load: Not Applicable
Exit Load: 10% of units can be redeemed without an exit load within 12 months of allotment. Any redemption in excess of such a limit in the first 12 months will incur 1% exit load. No exit load, if redeemed or switched out after 12 months from the date of allotment of unit.
Fresh Purchase (lumpsum): Rs. 5,000/- and in multiples of Re. 1/- thereafter
Systematic Investment Plan (SIP): Rs. 500 and above: minimum 12 installments.
The fund will be jointly managed by Mr. Umeshkumar Mehta, Mrs. Nirali Bhansali, Mr. Dhawal Ghanshyam Dhanani and Mr. Vishal Shinde.
Samco Dynamic Asset Allocation Fund - Direct IDCW


|
SAMCO DYNAMIC ASSET ALLOCATION FUND
(An open ended dynamic asset allocation fund) |
|
|
This product is suitable for investors who are seeking* :
|
|
Scheme Risk-o-meter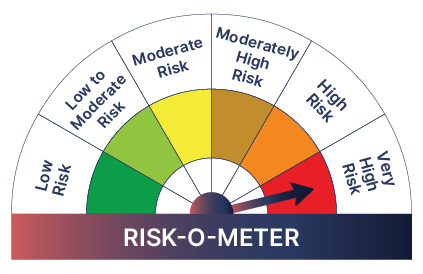
The risk of the scheme is very high Benchmark Risk-o-meter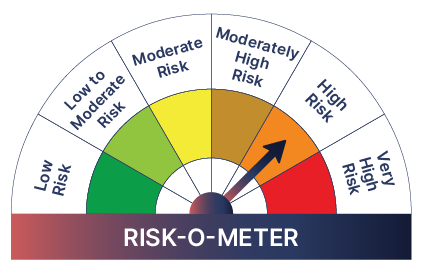
The risk of the Benchmark is high |
|
|
Risk-o-meter for Scheme: Basis it's portfolio, for Benchmark (NIFTY 50 Hybrid Composite Debt 50:50 Index): Basis it's constituents as on August 31, 2026 |
|
|
*Investors should consult their financial advisers if in doubt about whether the product is suitable for them. |
|
Mutual Fund investments are subject to market risks, read all scheme related documents carefully.


We will notify you once Samco Dynamic Asset Allocation Fund - Direct IDCW - Payout opens for subscriptions.
Enter the OTP received on mobile number +91  Edit
Edit

 +91 63572 22000



 You are already on the notification list to invest in


 Easy & quick

